With the working from home situation my wife has been complaining that the internet is somewhat slower which makes sense since we now have more devices on and streaming content... I have watched Frozen 1 and 2 over 30 times now..... but figured I should double check to see the actual numbers, so I consulted the good ol' site speedtest.net and ran couple tests and noticed that I am indeed getting sometimes half of what I'm paying for and some other times I do get more than I should. As FYI I'm paying $45 for 100 mbps which is pretty nice in my opinion.
Either way, I had no intention to keep visiting the site every so often and when my wife said it was slow I didn't want to check if my ISP was working properly so I discovered there's a CLI that executes that test we all know and love in the site and displays the results in machine readable formats. So here's when the engineer (lazy) part of my brain kicked in and gave me an obvious solution.... automate the whole thing. So overall here's what I said I would do.
- First step, get the CLI and run it couple times to know what the parameters you are looking for do, in my case i wanted something that would execute the test against a not so local server since it's not realistic that most of my internet requests end up couple miles from where i live.
- Second step, dump the data into a file that can be easily parsed and ingested into a system, in this case my preference is Elasticsearch since I can keep the data and I'm quite familiar with it so building the mapping and visualizations is super simple. The ingestion can be done by either writing a script to push it out or you can do it the lazy way and setup a filebeat agent that will simply collect the data from the results file in json format and will push that directly into my existing Elasticsearch cluster.
- Third step, generate some graphs to visualize how my ISP is treating me.
I won't go much into detail as this is supposed to be a quick post, but do let me know if you get stuck somewhere, social media details at the bottom.
- Download the CLI from the official site - https://www.speedtest.net/apps/cli
- Either create a cron task to run the script every X minutes or use a systemd timer unit (this depends on your preference completely). Here's my systemd timer and service files in case you want to copy it. Got place it in
/etc/systemd/system/and start & enable it usingsudo systemctl enable speedtest.timerthis should take care of calling the service every 10 minutes which is plenty for my case.
[Unit]
Description=Run the speed test cli

[Service]
User=$USER
Group=$USER
ExecStart=/home/$USER/speedtest/speedtest --server-id=2917 --format=json -u MiB/s
StandardOutput=append:/home/$USER/speedtest/speedtest.log
Type=oneshot

[Install]
WantedBy=default.target


[Unit]
Description=Runs speedtest every 10 minutes

[Timer]
OnCalendar=\*:0/10
Unit=speedtest.service

[Install]
WantedBy=default.target
- With that in place the script should place the output of the file under your home folder so make sure it exists.
- Next, you need to have filebeat running and configured to keep tabs in that
speedtest.logfile. Here's again a snippet of my configuration for bothfilebeat.ymland the service file that runs it.
[Unit]
Description=Filebeat
Documentation=https://www.elastic.co/guide
After=network.target

[Service]
Type=simple
Restart=always
User=$USER
Group=$USER
ExecStart=/home/$USER/apps/filebeat-7.5.2-linux-x86_64/filebeat -c /home/$USER/apps/filebeat-7.5.2-linux-x86_64/filebeat.yml

[Install]
WantedBy=multi-user.target
Since the file is already formatted as JSON we will tell filebeat we want to decode it as is and place the keys under root so we can search them, also I'm adding a field for those events so I can filter as needed. It's always a good idea and practice to "tag" your data.
filebeat.inputs:
  - type: log
enabled: true
paths:
  - /home/$USER/speedtest/speedtest.log
fields:
  source_system: speedtest
fields_under_root: true
json.keys_under_root: true
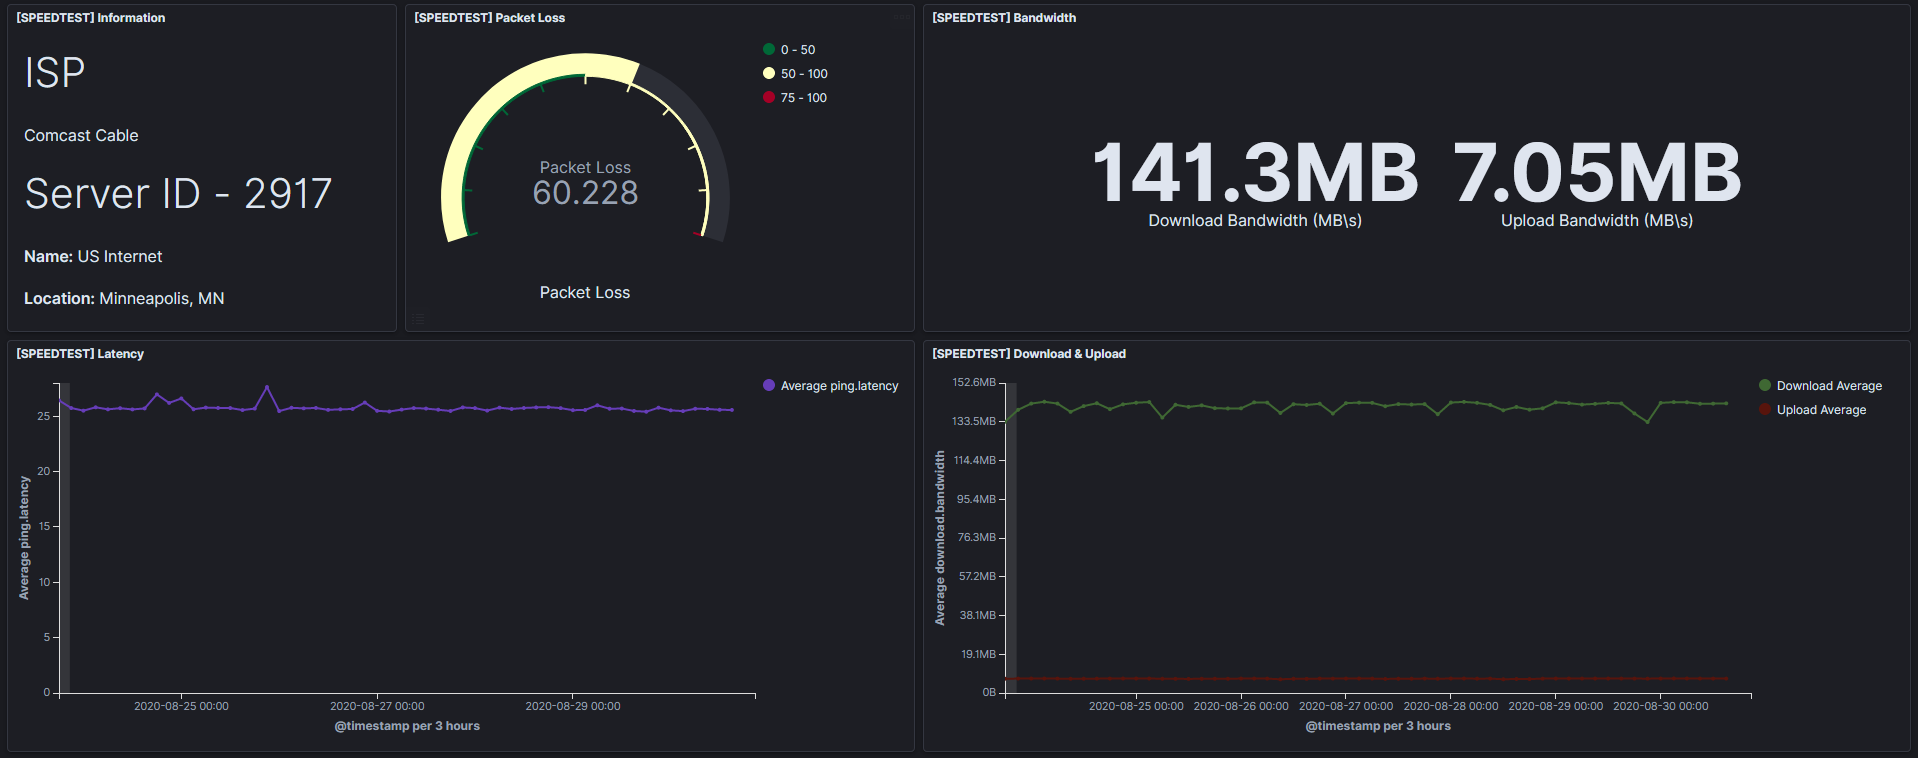
- With the data inside the cluster, all you got to do next is just build up some visualizations. Here's some of the ones I built using those details. Now I got a holistic view of how my ISP is treating me, can get historic data on how it behaved, the number of packets and ping I'm getting, it's quite nice.
As you can tell data is beautiful and with Kibana it's quite easy to visualize, this was a quick on how to ingest something from a script and use it to your advantage. I would like to also collect all of the packets coming in and out for all of my devices so I could measure my usage as well but that requires custom devices used as gateways and more complex setups.
See you in the next one.